
Environmental Markets Update December 2024
N-GEO Contracts Drive Doubling of CBL VCM Volume in November, PJM REC Volumes Jump
A surge of CBL’s N-GEO standardized contract and project-specific nature credit trading nearly doubled CBL VCM volumes month-over-month. More than 600,000 tons of OTC block trades priced between $0.30 and $4.10 per metric ton were settled through the CBL N-GEO and N-GEO Trailing vintage standardized contracts for the AFOLU sector.
The monthly volume increase mirrors last year’s pattern in which eight percent of the year’s volume was transacted in November, twice October’s level. This month is on pace to match last December’s 31% share as well. Over two million tons traded by mid-December, comprising 16% of 2024’s year-to-date activity.
CBL Launches Discrete Removals Trading and Portfolio Management
November saw the launch of new features enabling CBL participants to view and trade removals credits as a discrete market segment. The new capabilities are mirrored in the Xpansiv Connect portfolio management system, which supports full lifecycle management of removals, carbon, and renewable energy credit positions.
To date, six firms have posted RMV-tagged credits to the exchange. These participants include project developers Anew and c2invest. Anew posted 75,000 US forestry project removal credits to support the initiative.
Market Activity
Project-Specific VCM Credits
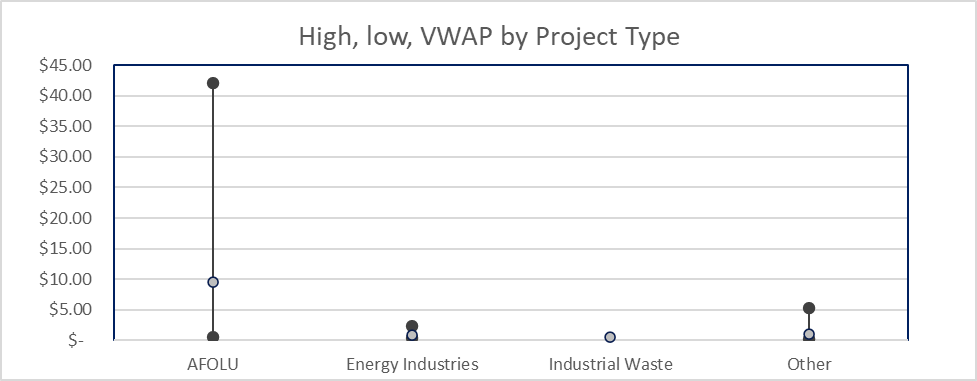
Nature credits led trading again in November. Over 60,000 recent vintage Asian reforestation credits transacted at prices between $25.00 and $42.00. The VWAP for AFOLU credits rose from $3.76 in October to $9.54 in November.
The VWAP for other sectors fell sharply, including energy, which drooped from $1.47 to $0.84, industrial waste, which dropped from $2.25 to $0.50, and other, which fell from $4.01 to $1.06.
Project-Specific Credits, November
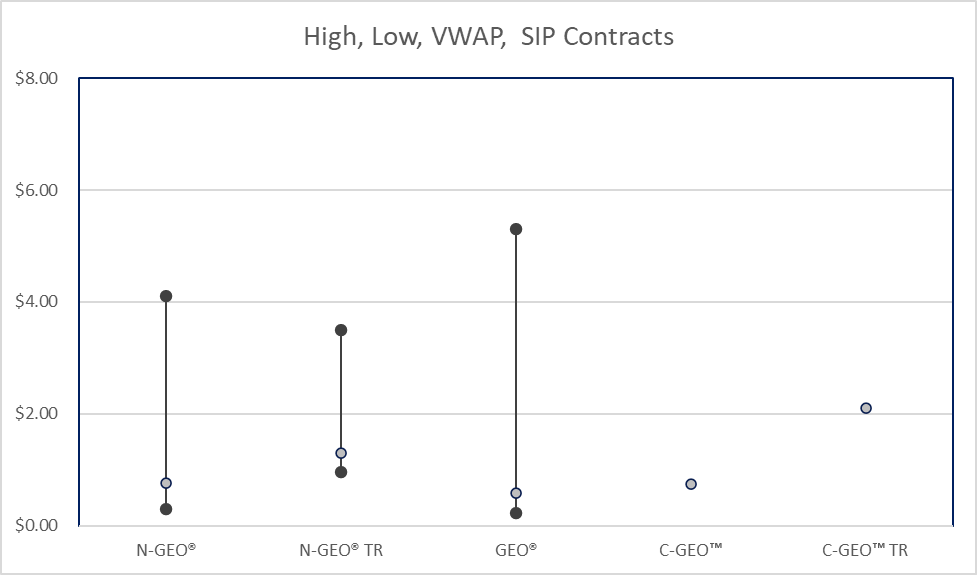
Standardized Global Emissions Offset™ (GEO®) Contracts, November
Block trade prices settled via CBL’s N-GEO contract swooned last month, falling from October’s VWAP of $18.10 to $0.77. This partly reflects the mix of AFOLU credits traded outright versus settled via the N-GEO. October’s highest-priced trade settled via the N-GEO was $26.60 versus $4.10 in November. In project-specific trading, however, October’s highest-priced AFOLU credit traded at $27.50 versus November’s $42.00 apex.
CBL VCM Volumes-November
| CATEGORY | TYPE | VOLUME | Change month/month |
| Credits | |||
| AFOLU | 249,552 | -6% | |
| Energy | 10,681 | -83% | |
| Industrial Processes | 5,000 | – | |
| Transportation | 943 | – | |
| Other | 17,250 | 299% | |
| SIP Contracts* | |||
| N-GEO® | 334,013 | 389% | |
| NGEO® TR | 370,069 | 241% | |
| GEO® | 17,643 | 782% | |
| C- GEO™ TR | 20,000 | 400% | |
| C-GEO™ | 10,000 | ||
| Total Volume | 1,035,151 |
*Contracts developed and governed under CBL’s Standard Instruments Program
| Most Active VCM Credits/Contracts | ||||||
| Contract | Volume | High | Low | VWAP | Change month/month | Change |
| NGEO-TR | 370,069 | $3.50 | $0.95 | $1.31 | $0.10 | 8% |
| NGEO | 334,013 | $4.10 | $0.30 | $0.76 | -$17.34 | -2281% |
| Rimba Raya Biodiversity Reserve | 75,100 | $5.25 | $3.95 | $3.95 | – | – |
| Mai Ndombe REDD+ | 70,000 | $0.50 | $0.50 | $0.50 | -$0.25 | -50% |
| Delta Blue Carbon | 49,060 | $32.00 | $26.00 | $26.76 | -$0.74 | -3% |
CBL Orders
Select newly entered bids and offers from the end of November are listed below.
They exclude bids/offers of under 1,000 tons. In addition to the displayed prices, nearly 400,000 tons of renewable energy and AFOLU bids and offers were placed at prices below $1.00 as were bids for 175,000 tons of renewable energy and older Mai Ndombe, Southern Cardamom, and Kasigua AFOLU credits priced between $0.25-$0.30.
| Std. | ID | Name | Type | Country | Year | Qty. | Price | Side |
| GS | 7646 | Safe Water | Energy Efficiency | Mozambique | 2023 | 20,000 | 8.00 | ASK |
| GS | 5125 | Eritrea Community Boreholes | Energy Efficiency | Eritrea | 2021 | 18,250 | 8.00 | ASK |
| GS | 11205 | Cookstove | Energy Efficiency | Rwanda | 2022 | 10,000 | 7.00 | ASK |
| VCS | 2087 | Chudu Afforestation Project | AFOLU | China | 2017 | 26,847 | 3.50 | ASK |
| VCS | 3279 | IDCOL Cook Stove- CER | Energy Demand | Bangladesh | 2020 | 10,154 | 3.00 | ASK |
| VCS | 2082 | Qianbei Afforestation Project | AFOLU | China | 2016 | 21,135 | 2.75 | ASK |
| VCS | 1650 | Keo Seima Wildlife REDD | AFOLU | Cambodia | 2017 | 1,776 | 2.50 | BID |
| VCS | 1718 | Inner Mongolia Keyihe IFM | AFOLU | China | 2018 | 3,000 | 2.30 | BID |
| VCS | 1199 | Bugoye 13.0 MW Hydro | Energy Industries | Uganda | 2015 | 22,243 | 2.00 | ASK |
| VCS | 1441 | Bundled clean energy | Energy Industries | India | 2019 | 2,000 | 2.00 | ASK |
| VCS | 1441 | Bundled clean energy | Energy Industries | India | 2019 | 2,000 | 2.00 | ASK |
| VCS | 2508 | UNITOR REDD+ | AFOLU | Brazil | 2022 | 1,951 | 1.85 | ASK |
| VCS | 1859 | Heqing Solar Cooker | Energy Industries | China | 2017 | 18,927 | 1.75 | ASK |
| ACR | 556 | Foam Blowing Agent | Mining/mineral | United States | 2019 | 52,576 | 1.75 | ASK |
| VCS | 1441 | Bundled clean energy | Energy Industries | India | 2019 | 2,000 | 1.70 | ASK |
| ACR | 656 | Whirlpool HFO Amana 656 | Industrial Process | United States | 2019 | 2,500 | 1.50 | ASK |
| ACR | 455 | Foam Blowing Agent | Industrial Process | United States | 2018 | 6,309 | 1.50 | ASK |
| VCS | 1441 | Bundled clean energy | Energy Industries | India | 2019 | 2,000 | 1.50 | ASK |
| VCS | 1650 | Keo Seima Wildlife REDD | AFOLU | Cambodia | 2016 | 15,000 | 1.50 | ASK |
| VCS | 2478 | Gas Leakage, Titas, CER | Fugitive emissions | Bangladesh | 2018 | 2,343 | 1.40 | ASK |
| VCS | 1650 | Keo Seima Wildlife REDD | AFOLU | Cambodia | 2015 | 37,000 | 1.25 | ASK |
| VCS | 2252 | Rio Anapu-Pacaja REDD | AFOLU | Brazil | 2018 | 16,724 | 1.20 | ASK |
| VCS | 2252 | Rio Anapu-Pacaja REDD | AFOLU | Brazil | 2017 | 94,331 | 1.10 | ASK |
| VCS | 1485 | Chorokhi Hydro Power Plant | Energy Industries | Georgia | 2019 | 1,000 | 1.00 | ASK |
| VCS | 1953 | Floresta Verde REDD+ Project | AFOLU | Brazil | 2016 | 5,620 | 1.00 | ASK |
VCM Spot and Futures Volume
Over one million tons were traded on CBL across project-specific credits and the exchange’s Global Emissions Offset™ (GEO®) standardized contracts in November. CME Group’s CBL emissions futures complex transacted another 3,848,000 tons during the month.
| CME Group CBL GEO Futures Contracts | ||||||
| Contract | Volume | Average Open Interest | OI Change month/month | Dec 2024 Close | Change month/month | % Change |
| N-GEO | 1,764 | 3,811 | -307 | $0.47 | $0.07 | 18% |
| GEO | 2,084 | 4,022 | -197 | $0.45 | $0.01 | 2% |
| C-GEO | 0 | 26 | 0 | $0.36 | -$0.09 | -20% |
| Total | 3,848 | 7,859 | -504 |
Source: CME Group data compiled by Xpansiv Data and Analytics
North American Compliance Market Activity-November
PJM markets drove US REC trading in November as volumes totaled 126,702, up 4% from October. Trading was driven in part by increased trade in Pennsylvania solar credits of which nearly 19,000 were exchanged. Vintage 2025 credits were the most actively traded, averaging $34.00 per credit.
Maryland markets were also active last month with 33,573 credits traded between vintage 2024 solar and tier one markets. Average prices were level at $34.00 for tier one credits, and $58.00 for solar. Other active markets included New Jersey solar, which saw 9,633 credits exchanged and Virginia distributed generation which added 10,901 credits to CBL’s monthly total of 136,800 credits.
NEPOOL markets had a comparatively slow month in November, logging 10,098 credits traded across seven different markets.
| North American REC Markets | ||||
| Instrument Name | Volume (MWh) | VWAP | Change month/ month | Change |
| MD1v24 | 17,974 | $34.00 | $0.00 | 0% |
| PASRv25 | 17,171 | $33.84 | -$1.41 | -4% |
| MDSRv24 | 15,599 | $58.00 | -$0.23 | 0% |
| NJSRv25 | 9,633 | $202.50 | $0.10 | 0% |
| VADGv24 | 8,923 | $36.25 | $0.00 | 0% |
CBL REC Volumes-November
| MARKET | TYPE | VOLUME | CHANGE month/month | CHANGE |
| PJM | PASR | 18,935 | 18,638 | 6275 % |
| PJM | MD1 | 17,974 | 5,794 | 48% |
| PJM | MDSR | 16,886 | -1,628 | -9% |
| PJM | PA1 | 14,712 | -2,262 | -13% |
| PJM | VADG | 10,901 | 1,742 | 19% |
| PJM | VA | 10,175 | 3,675 | 57% |
Xpansiv Data and Analytics
Except where noted, the data in this report is from the Xpansiv Data and Analytics database of spot firm and indicative bids/offers and transaction data. The data is from CBL, the world’s largest spot environmental commodity exchange. CBL has a 90+% global market share of exchange-traded spot carbon credits and a growing share of voluntary and compliance REC trading.
Xpansiv provides daily and historical bid, offers, and transaction data for carbon credits, compliance, and voluntary renewable energy certificates, as well as Australian Carbon Credit Units (ACCUs) traded on the CBL platform.
This spot data is supplemented by spot and forward prices from premier market intermediaries, as well as aggregated registry statistics and ratings from leading providers.
The historical, end-of-day, and streaming data is available by API, daily email, or download.
For more information, please contact xsignals@xpansiv.com
CBL Standardized Contracts Key:
ICVCM CCP Global Emissions Offset™: Specifications for the new registry-specific contracts are in the CBL Operating Rules, specifically Schedules 27-29, and the CBL Standard Instruments Program, beginning at page 24.
N-GEO, Nature-Based Global Emissions Offset™: The N-GEO prices a basket of VCS credits with AFOLU and CCB standards from vintages 2019-2024. The vintage range rolls forward annually on July 1.
N-GEO Trailing: The N-GEO Trailing has the same eligibility criteria as the N-GEO, except with a 2016-2018 vintage range. The vintage range expands annually on July 1.
GEO, Global Emissions Offset™: The GEO tracks a basket of credits aligned with the initial, trial phase of the UN’s CORSIA offsetting and reduction scheme for international airlines. Eligible credits are from the ACR, CAR, and VCS standards from 2016-2020 vintages.
C-GEO, Core Global Emissions Offset™: The C-GEO prices a basket of VCS credits aligned with eligibility criteria established by ICROA and the TSVCM from vintages 2019-2024. The vintage range rolls forward annually on July 1.
C-GEO Trailing: The C-GEO Trailing has the same eligibility criteria as the C-GEO, except with a 2013-2018 vintage range. The vintage range expands annually on July 1.
SD-GEO, Sustainable Development Core Global Emissions Offset™: The SD-GEO tracks a basket of GS and VCS cookstove credits with at least five (5) UN SDGs. The current vintage range is 2019-2024. The vintage range rolls forward annually on July 1.
More information on the exchange’s spot standardized contracts is in the Standard Instruments Program document on our website. Information on the CBL GEO futures contracts are available on the CME Group website.
Existing Participants may log in here to take a closer look or list orders.
Interested in learning more?
For data inquiries, contact xsignals@xpansiv.com.
For more information on CBL, contact exchange@xpansiv.com.
Phone:
AU: +61 2 8090 3434
US: +1 833 972 6677 x2
UK: +44 20 4570 5210